Why You Shouldn't Compare Your Portfolio to the S&P 500

Most folks turn on the news, hear that the S&P 500 hit another record, and immediately wonder how their own accounts stack up. It's a natural reaction. It's also the wrong yardstick, and it causes more bad investing decisions than just about anything else we see.
Here's the deal. The S&P 500 is 500 companies. The stock market is thousands. And more importantly, the S&P 500 only covers two of the four categories Dave Ramsey teaches you to spread your money across. It's a blend of Growth (the big, fast-moving companies everybody's talking about) and Growth & Income (the big, boring, dividend-paying companies nobody brags about at a cookout). That's it. It contains no Aggressive Growth — the small and mid-sized companies — and no International whatsoever.
So when you compare your properly diversified portfolio to the S&P 500, you're comparing four things to two things. That's not a scorecard. That's a setup for frustration, and frustration is what makes people do dumb stuff with their money.
The reason we spread money across all four categories is simple: they don't move together. AI, oil prices, interest rates, tariffs — these things hit every part of the market, but they hit each part differently. And over the past year, the parts the headlines ignore have been the parts doing the work. Smaller companies, value-oriented companies, and international companies have all outperformed, and their prices are still more reasonable than the big names everyone's chasing.
Let's look at what's actually going on under the hood.
Different sizes and styles are affected by market conditions in unique ways

The overall market has put up double-digit returns this year.¹ But underneath that number, two things have flipped.
First, value has beaten growth over the past year. That's a reversal of what we'd seen since 2022, when technology and AI pulled growth stocks way out in front.²
This value-versus-growth thing isn't some Wall Street parlor game, by the way. Academics have been studying it for 50 years.³ Value companies are the ones trading cheap relative to what they actually earn and sell — in Dave's language, that's largely your Growth & Income category. Big, established, often dividend-paying, and about as exciting as watching paint dry. Growth companies trade at higher prices because investors expect earnings and market share to climb — that's your Growth category. The names change with the decade. It was dot-com stocks in 1999. It's AI stocks today.
Why has value led? A couple of reasons. Energy has been strong on high oil prices.⁴ And interest rates are sitting near multi-decade highs, which hurts growth stocks more than value stocks. When a company's price is built on earnings it expects to make years from now, higher rates make those future dollars worth less today. Simple as that.
Second, small caps have beaten large caps, reversing a trend that ran for well over a decade. Before this year, small caps had trailed the S&P 500 going back to 2020.⁵
This is your Aggressive Growth category — the Russell 2000 and the mid-cap and small-cap world generally. And notice something: Aggressive Growth isn't one flavor either. It breaks down the same way the big companies do. There's mid-cap growth, small-cap growth, small-cap value — which is really just Growth & Income wearing a smaller jersey. Same logic, smaller companies.
A lot of people assume AI is strictly a big-company story. It isn't. Somebody has to make the equipment, the components, and the services that go into building data centers and the infrastructure around them, and a lot of those somebodies are smaller industrial and technology companies. Their revenue and earnings growth right now competes with anything else in the market.
The knock on small caps is that they're more sensitive to interest rates, because they don't have the same access to cheap financing that the giants do. That's created real uncertainty lately with long-term rates staying high and the possibility of Fed hikes back on the table. But history doesn't agree that high rates are automatically fatal for small companies. Two of the strongest stretches for small-cap performance came in the late 1970s and the mid-2000s — both periods with higher rates and higher inflation.⁶ One reason is that smaller businesses can sometimes raise prices faster, which protects their margins.
Valuations matter for long-term investing
Here's where this gets practical instead of academic.
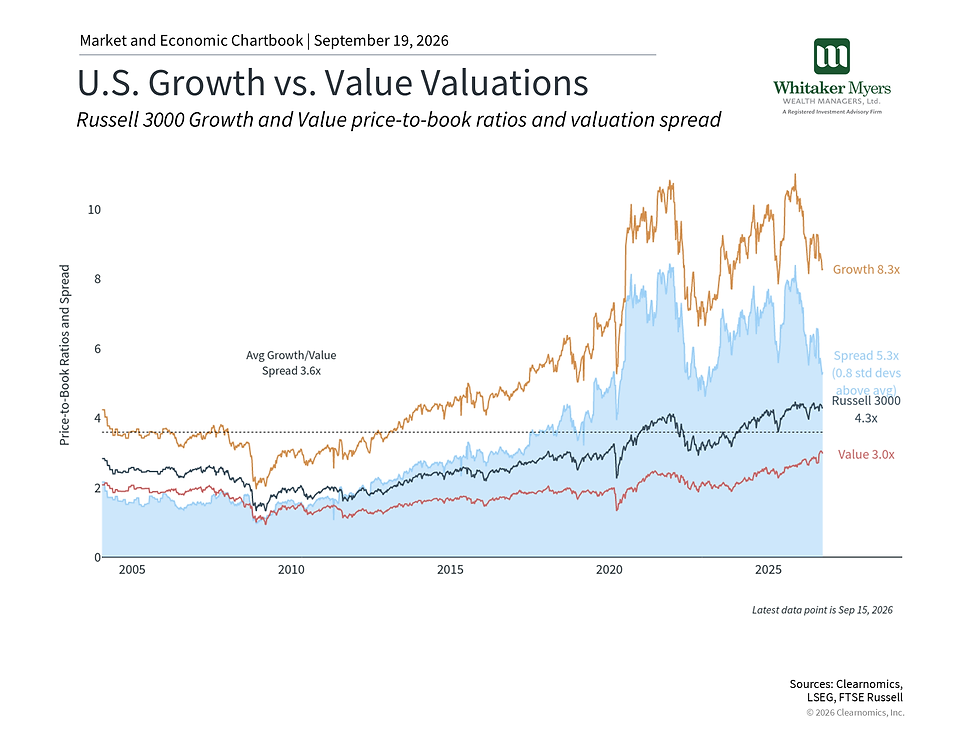
The reason we care about these categories isn't last year's return. It's what you're paying to own something. Over long periods, paying less has historically meant earning more going forward. Not guaranteed — nothing is — but that's the pattern.
The market moves in what people call "regimes." Stretches where one style leads. They can run for months, or years, or decades. Value led for most of the 20th century until growth took the wheel in the dot-com era. And when a regime is in full swing, it always feels permanent. It never is.
The chart here shows the gap between growth and value valuations using price-to-book. Growth stocks — especially the largest technology companies — are sitting near historically high valuations.⁷ Value stocks and smaller companies are priced far more reasonably. Now, past performance doesn't guarantee anything, and cheap can stay cheap. But it explains why leadership has shifted, and it's a pretty good argument for owning all four categories instead of just the two that have been fun to own.
And this is exactly why we tell clients not to chase. The person who dumped everything into large-cap Growth in 2021 because that's what was working spent the next couple of years learning an expensive lesson. The answer isn't to guess which regime is next. The answer is to own all four, rebalance when they drift, and quit checking the score every afternoon.
International markets are another source of diversification
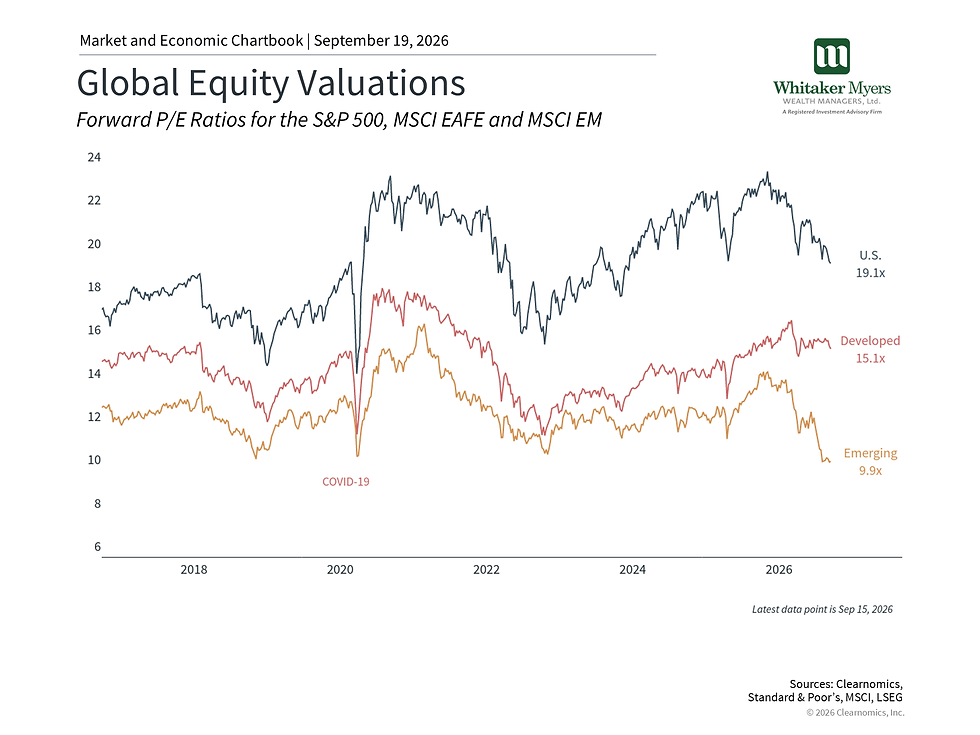
Everything we just said about sizes and styles applies to geography too. Different economies respond to different pressures at different times, which is precisely why International is the fourth category and not an afterthought.
The MSCI EAFE Index — developed markets outside the U.S. and Canada — is the core of what this category looks like in a portfolio. Emerging markets have had a good year as earnings expectations improved and valuations got more attractive.⁸ The accompanying chart shows that both emerging and developed international stocks still trade well below U.S. valuations on a number of measures. U.S. stocks outperformed for most of the past decade, and plenty of people concluded international was a waste of time. Returns since the beginning of last year say otherwise. These things turn without warning.
International investing carries its own risks — geopolitical, currency, regulatory. But understand something: those risks are the reason it works as diversification. If international stocks behaved exactly like U.S. stocks, owning them wouldn't accomplish anything. You want something in your portfolio that doesn't march in lockstep with everything else. It's also worth noting that many large U.S. companies generate a big chunk of revenue overseas, so you're getting some global exposure without even trying.
What actually belongs in your portfolio depends on your goals, your timeline, and how much bumpiness you can stomach without bailing out. The point isn't to predict whether small caps keep leading or whether value keeps winning. The point is that the market is enormously bigger than the dozen companies that make the headlines.
The bottom line? The S&P 500 is a fine thermometer for part of the market. It is a terrible report card for your portfolio, because it's missing half of what you should own. Spread your money evenly across Growth, Growth & Income, Aggressive Growth, and International.
Rebalance. Stay put through the noise. That's not flashy advice, and it never will be — but boring and consistent has made a whole lot more millionaires than clever and reactive.
If you're not sure whether your accounts actually cover all four categories, that's a conversation worth having. Talk to your Whitaker-Myers Wealth Managers Financial Advisor.
References
1. S&P 500 Index as of September 11, 2026
2. Clearnomics research and the Russell 3000 Value and Growth indexes, as of September 11, 2026
3. Fama and French, 1992, “The Cross-Section of Expected Stock Returns,” https://www.jstor.org/stable/2329112
4. Clearnomics research, LSEG and FTSE Russell, as of September 11, 2026
5. Clearnomics research and the Russell 2000 Index, as of September 11, 2026
6. Banz, 1981, “The Relationship Between Return and Market Value of Common Stock,” https://www.sciencedirect.com/science/article/abs/pii/0304405X81900180
7. Clearnomics research, LSEG and FTSE Russell, as of September 11, 2026
8. Clearnomics research and the MSCI Emerging Markets Index, as of September 11, 2026
Index Descriptions
S&P 500
The Standard & Poor’s 500 Index is a capitalization-weighted index of 500 stocks designed to measure performance of the broad domestic economy through changes in the aggregate market value of 500 stocks representing all major industries.
Russell 3000
The Russell 3000 Index is a stock market index that tracks the performance of the 3,000 largest companies listed on the U.S. stock exchange.
Russell 2000
The Russell 2000 Index is a capitalization-weighted index designed to measure the performance of the small-cap segment of the U.S. equity universe. It includes approximately 2,000 of the smallest securities in the Russell 3000 Index.
MSCI Emerging Markets Index
The MSCI EM (Emerging Markets) Index is a free float-adjusted market capitalization weighted index that is designed to measure the equity market performance of the emerging market countries of the Americas, Europe, the Middle East, Africa and Asia. The MSCI EM Index consists of the following emerging market country indices: Brazil, Chile, Colombia, Mexico, Peru, Czech Republic, Egypt, Greece, Hungary, Poland, Qatar, Russia, South Africa, Turkey, United Arab Emirates, China, India, Indonesia, Korea, Malaysia, Philippines, Taiwan, and Thailand.
MSCI EAFE Index
The MSCI EAFE Index is a free float-adjusted market capitalization index that is designed to measure the equity market performance of developed markets, excluding the US & Canada. The MSCI EAFE Index consists of the following developed country indices: Australia, Austria, Belgium, Denmark, Finland, France, Germany, Hong Kong, Ireland, Israel, Italy, Japan, the Netherlands, New Zealand, Norway, Portugal, Singapore, Spain, Sweden, Switzerland and the UK.
The information presented is for informational and educational purposes only and should not be considered investment, tax, or legal advice. Whitaker-Myers Wealth Managers does not guarantee the accuracy, completeness, or timeliness of the information provided, and it should not be relied upon as a basis for making investment decisions.The S&P 500 Index is a market-capitalization-weighted index that represents 500 of the largest publicly traded companies in the United States. It is widely used as a benchmark for overall stock market performance but does not represent all available investment opportunities. Past performance of the S&P 500 or any other market index is not indicative of future results. Investing in equities involves risks, including market volatility and potential loss of principal.Investors should carefully consider their financial goals, risk tolerance, and time horizon before making any investment decisions. Diversification and asset allocation do not ensure a profit or protect against losses in declining markets. Market conditions can change, and there is no guarantee that any investment strategy will be successful.Whitaker-Myers Wealth Managers and its advisors do not provide tax or legal advice. Investors are encouraged to consult with a qualified financial professional, tax advisor, or attorney regarding their specific situation. All investment strategies should align with an individual’s financial needs and objectives.Investing involves risk, including possible loss of principal. Whitaker-Myers Wealth Managers does not guarantee any specific investment outcomes or performance results.For more information, please contact Whitaker-Myers Wealth Managers.